There goes my low latency: Analyzing hiccups with jHiccup, Elasticsearch and Kibana
Written on
Image by USMC Archives ; license: CC
The other day I had to analyze search latency spikes in Elasticsearch for a customer. When latency spikes are involved, one of the first things I want to know is the “noiseness” of the host where the problem occurs.
A great tool that helps with this analysis is Gil Tene’s jHiccup. It records hiccups in the application and also in a control process. One thing that bugged me about jHiccup for a long time is that you need to Microsoft Excel to visualize the data. However, I don’t own an MS Office license and as much as I like jHiccup, I won’t buy a license just for that.
So I thought about alternatives. At Elastic, we store our benchmark results also in Elasticsearch and visualize the data in Kibana. As I wanted to analyze multiple data sources anyway, it made sense to import the data into Elasticsearch. jHiccup comes with a tool, called jHiccupLogProcessor that can convert jHiccup files to CSV. After a few unsatisfying experiences with a few CSV to JSON converters, I hacked together a small Python script that can convert just jHiccup’s CSV file format to Elasticsearch bulk requests and imported the file with curl.
This approach worked but is also cumbersome. Apart from that I figured other people might benefit from an import tool to Elasticsearch too. So I spiced up the script a little bit and the result is hiccup2es. Although it is really basic, it is a start and allows you to import data into Elasticsearch in one step. It even creates the index for you.
It is quite easy to use (I hope). Suppose you have a CSV jHiccup log called “hiccuplog.csv” that has been created by jHiccupLogProcessor. Then you can import the data into your local Elasticsearch cluster in one step:
python3 hiccup2es.py --input-file=hiccuplog.csv --create-indexThat’s it! hiccup2es assumes a lot of defaults, so if you want to know what you can configure, run hiccup2es –help to find out.
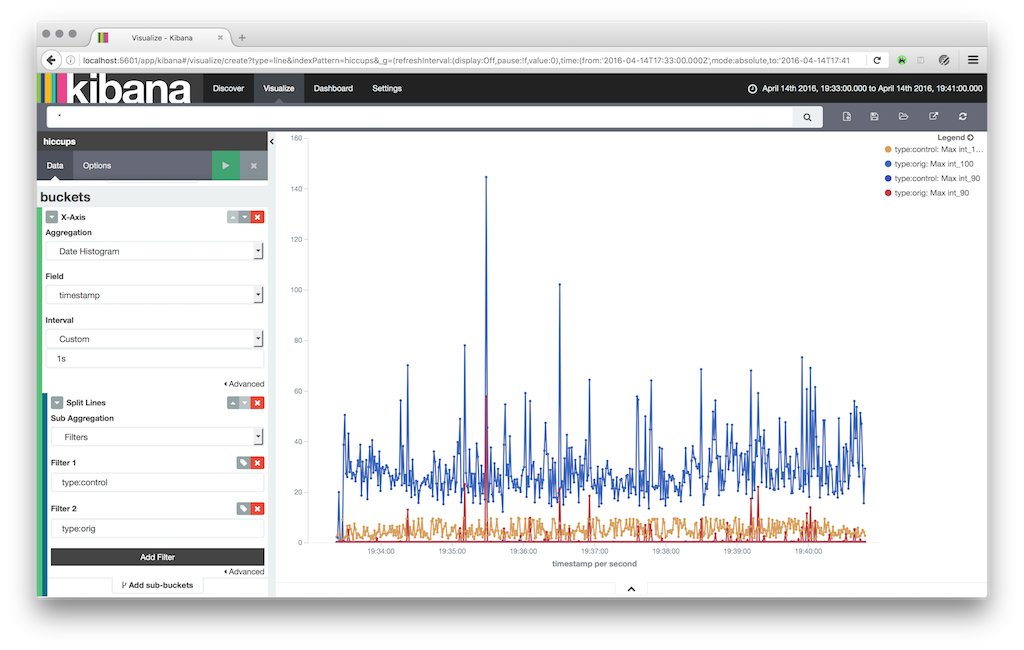
After the data are imported, you can easily create a nice looking visualization in Kibana. Here is a hiccup log during a benchmark I ran on my local machine:
I hope you find hiccup2es as useful as I do. If you want to know more, just contact me on Twitter. If you find a problem or can think of any enhancement, just raise an issue on Github.