Microbenchmarking on the JVM with JMH
Javaland 2015
Daniel Mitterdorfer
@dmitterd
comSysto GmbH
Agenda
- Definitions
How to measure performance? What is benchmarking? - Problem
Why are benchmarks on the JVM hard? - Solution
Introduction to the Java Microbenchmarking Harness (JMH)
How to Determine Performance?
- Analysis
to determine performance characteristics of a system upfront (e.g. Big-O notation) - Profiling
to find bottlenecks in a system - Benchmarking
to compare the relative performance of systems
Benchmark Scopes
- Macrobenchmark
An entire system (application level) - Microbenchmark
A single component - (Mesobenchmark)
Purpose of Benchmarking
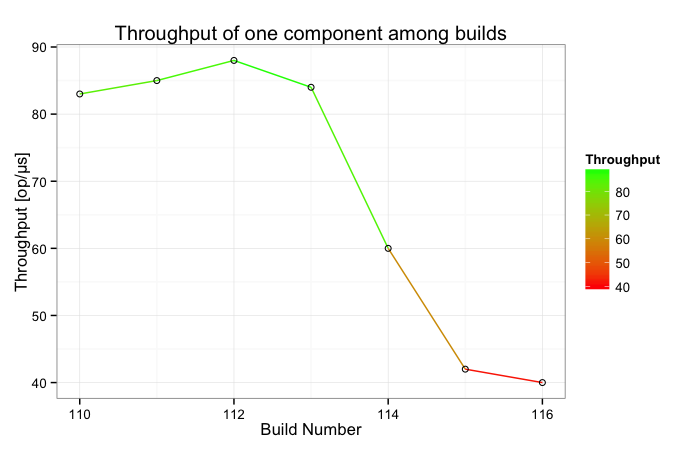
Find performance regressions in critical components.
Purpose of Benchmarking
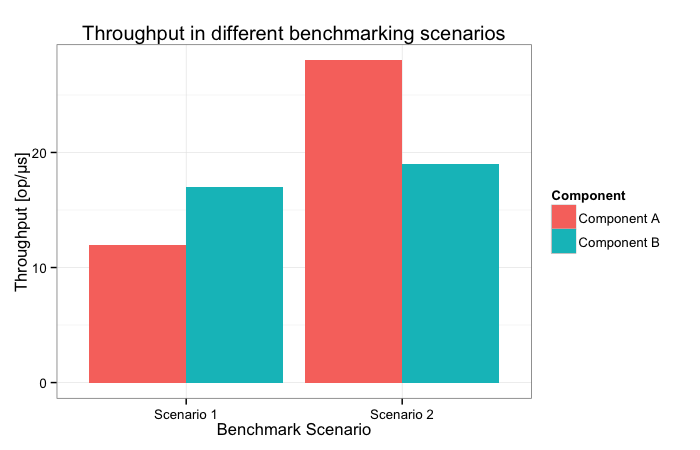
Compare alternative implementations or system configurations
Purpose of Benchmarking
Understand the low-level behavior of system components

Purpose of Benchmarking
Ultimate purpose: Derive a performance model for a component
Writing Benchmarks is Easy...
Example: How long does it take to calculate the sum of an array?
public class SumBenchmark {
  public static double sum(double[] array) {
    double total = 0.0d;
    for (int i = 0; i < array.length; i++) {
      total += array[i];
    }
    return total;
  }
}
Writing Benchmarks is Easy...
public class SumBenchmark {
  private static final int BATCH_SIZE = 15000;

  private static void benchmarkSum(double[] array) {
    long start = System.nanoTime();
    for (int j = 0; j < BATCH_SIZE; j++) {
      sum(array);
    }
    long stop = System.nanoTime();
    System.out.printf("Computation finished in %d ns.%n",
    				   ((stop - start) / BATCH_SIZE));
  }
}
Writing Benchmarks is Easy...
Benchmarking Scenario: Benchmark with 10.000 array elements
public class SumBenchmark {
  public static void main(String[] args) {
    double[] array = new double[10000];
    // initialize array with some values
    for (int i = 0; i < array.length; i++) {
      array[i] = (double)i;
    }
    // perform actual benchmark
    for (int iteration = 0; iteration < 10; iteration++) {
      benchmarkSum(array);
    }
  }
}
... Except when it's not
Computation finished in 11561 ns.
Computation finished in 447 ns.
Computation finished in 0 ns.
Computation finished in 0 ns.
[...]
Computation finished in 0 ns.
0 ns? Really?

What happened?
Rerun with -XX:+PrintCompilation
[...]
123    7    name.mit[...].SumBenchmark::sum (24 bytes)
127    1 %  name.mit[...].SumBenchmark::sum @ 4 (24 bytes)
293    2 %  name.mit[...].SumBenchmark::benchmarkSum @ 6 (51 bytes)
306    8    java.lang.String::indexOf (166 bytes)
Computation finished in 11561 ns.
313    9    name.mit[...].SumBenchmark::benchmarkSum (51 bytes)
319    2 %  name.mit[...].SumBenchmark::benchmarkSum @ -2 (51 bytes) made not entrant
Computation finished in 447 ns.
Computation finished in 0 ns.
Computation finished in 0 ns.
[...]
Computation finished in 0 ns.
The JIT compiler kicks in and eliminates the benchmark loop
Dead Code Elimination - A Closer Look
  private static void benchmarkSum(double[] array) {
    long start = System.nanoTime();
    for (int j = 0; j < BATCH_SIZE; j++) {
      // (1) The return value is never used, let's eliminate the call
      sum(array);
    }
    long stop = System.nanoTime();
    System.out.printf("Computation finished in %d ns.%n",
    				   ((stop - start) / BATCH_SIZE));
  }
Only illustrative: HotSpot may implement this differently
Dead Code Elimination - A Closer Look
  private static void benchmarkSum(double[] array) {
    long start = System.nanoTime();
    for (int j = 0; j < BATCH_SIZE; j++) {
    // (2) The loop body is empty, let's eliminate the loop
    }
    long stop = System.nanoTime();
    System.out.printf("Computation finished in %d ns.%n",
    				   ((stop - start) / BATCH_SIZE));
  }
Only illustrative: HotSpot may implement this differently
Dead Code Elimination - A Closer Look
  private static void benchmarkSum(double[] array) {
    long start = System.nanoTime();
    //(3) Huh, were is the benchmark?
    long stop = System.nanoTime();
    System.out.printf("Computation finished in %d ns.%n",
    				   ((stop - start) / BATCH_SIZE));
  }
Some Sources of Pitfalls
- JIT-Compiler
Implements dozens of optimizations - Garbage Collector
Runs at unpredictable times - Operating System/JVM
Different implementations will have different performance characteristics - CPU
Singlecore vs. Multicore - Tons of problems you haven't even considered
False sharing and other cache effects, timer accuracy, CPU's C-states, branch prediction and many more
Haunted by Cliff Click
“Without exception every microbenchmark I've seen has had serious flaws. Except those I've had a hand in correcting.”
Java Microbenchmarking Harness
- Best practices are baked in
Avoids lots of flaws of handwritten microbenchmarks; still no silver bullet - Batteries included
Supports different metrics (called "benchmark modes"), multithreaded tests, parameterized benchmarks, multiple language bindings (Scala, Groovy, Kotlin), etc. - Open source; developed by experts
OpenJDK subproject (maintainers: Aleksey Shipilёv and Sergey Kuksenko from Oracle) - De-facto standard
Used by JDK developers, growing user base outside of Oracle (e.g. Netty, Reactor, Azul)
Microbenchmarking Best Practices
- Warmup
JMH performs multiple warmup iterations before actual measurement iterations - Mitigate Energy Saving Settings
JMH benchmarks run multiple iterations and do not park benchmarking threads to keep the CPU busy - Compiler optimizations
JMH provides support to avoid or control compiler optimizations - Run-to-run variance
JMH creates multiple JVM forks; variance is reported ("score error")
Hello JMH
import org.openjdk.jmh.annotations.Benchmark;

public class HelloJMHMicroBenchmark {
  @Benchmark
  public void hello() {
    //intentionally left blank
  }
}
Generating HelloJMHMicroBenchmark
mvn clean install@Benchmarkannotated method => one benchmark class- Run the self-contained JAR
Running HelloJMHMicroBenchmark
# Run progress: 0,00% complete, ETA 00:06:40
[...]
# Fork: 1 of 10
# Warmup Iteration   1: 1442257053,080 ops/s
[...]
# Warmup Iteration  20: 436917769,398 ops/s
Iteration   1: 1462176825,349 ops/s
Iteration   2: 1431427218,067 ops/s
[...]

# Run complete. Total time: 00:08:06

Benchmark           Mode   Samples          Score  Score error    Units
n.m.b.j.H.hello    thrpt       200 1450534078,416 29308551,722    ops/s
Benchmarking Array Sum with JMH
import org.openjdk.jmh.annotations.*;

@State(Scope.Benchmark)
public class SumBenchmark {
  private double[] values;

  @Setup
  public void setup() {
    this.values = new double[10000];
    for (int i = 0; i < values.length; i++) {
      values[i] = (double)i;
    }
  }

  @Benchmark
  public double calcSum() {
    return sum(values);
  }
}
Running SumBenchmark
# Run progress: 0,00% complete, ETA 00:06:40
# Warmup: 20 iterations, 1 s each
# Measurement: 20 iterations, 1 s each
# Threads: 1 thread, will synchronize iterations
# Benchmark mode: Throughput, ops/time
# Benchmark: name.mitterdorfer.benchmark.jmh.SumBenchmark.calcSum
[...]
# Fork: 1 of 10
# Warmup Iteration   1: 89162,938 ops/s
# Warmup Iteration   2: 91655,330 ops/s
[...]
# Run complete. Total time: 00:08:04

Benchmark                      Mode  Samples      Score  Score error  Units
n.m.b.j.SumBenchmark.calcSum  thrpt      200  92684,491      395,882  ops/s
Score based on array size (10.000 elements). Use @OperationsPerInvocation to normalize the reported throughput if needed.
Complex Microbenchmarks with JMH
@State
Annotate benchmark state scoped to the benchmark, a single benchmark thread or a benchmark group@Threads
Execute multithreaded microbenchmarks@CompilerControl
Offers limited control over the JIT compiler's behavior (e.g. inlining of a specific method)- Profilers
Pluggable profilers to observe microbenchmark behavior, e.g. gc, comp, perf
For more information please study the official JMH samples.
Case Study: JMH perf profiler
Prefetching Unit
CPU speculatively loads data based on memory access patterns
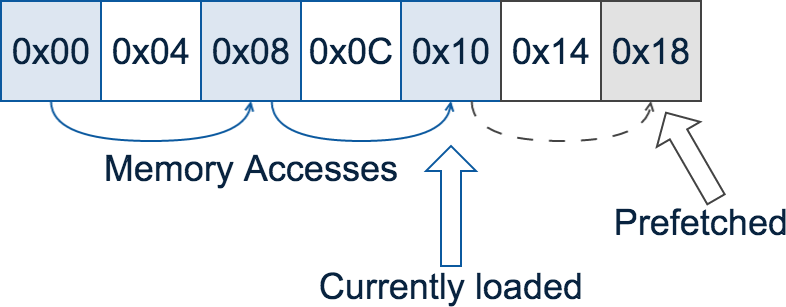
Contenders: int[]
Contiguous array: Linear memory access pattern for traversal:
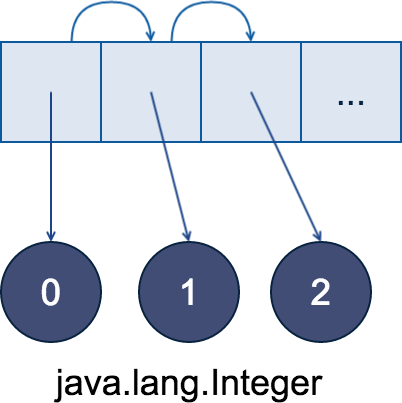
Contenders: ArrayList
Linear memory access pattern for array traversal; pointer chasing for elements:
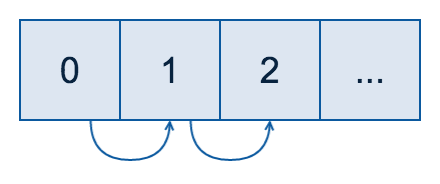
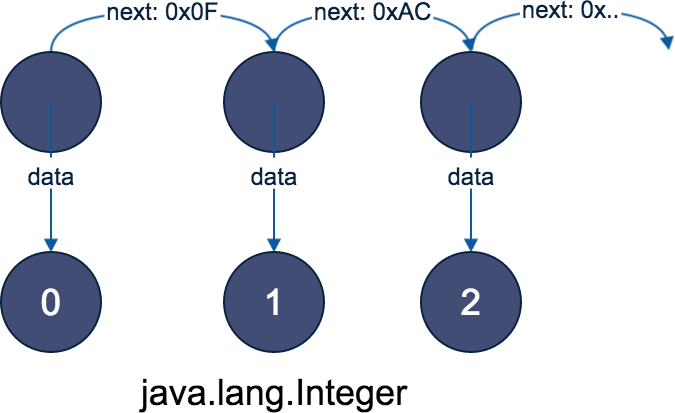
Contenders: LinkedList
Nonlinear memory access pattern for traversal and elements:
Experiment Setup
- Task: Calculate the sum of all elements
Benchmark: Setup LinkedList
@State(Scope.Benchmark)
public class PointerChasingBenchmark {
  @Param({"1024", "2048", "4096", "8192", "16384", "32768"})
  public int problemSize;

  private final List<Integer> linkedList = new LinkedList<>();

  @Setup
  public void setUp() {
      for (int idx = 0; idx < problemSize; idx++) {
          linkedList.add(idx);
      }
  }
  // ...
}
Note: the other setup methods are identical except for their type
Benchmark: LinkedList
@State(Scope.Benchmark)
public class PointerChasingBenchmark {
  // .. Setup ..

  @Benchmark
  public long sumLinkedList() {
    long sum = 0;
    for (int val : linkedList) {
      sum += val;
    }
    return sum;
  }
}
Note: the other benchmark methods are identical except for their type
Results
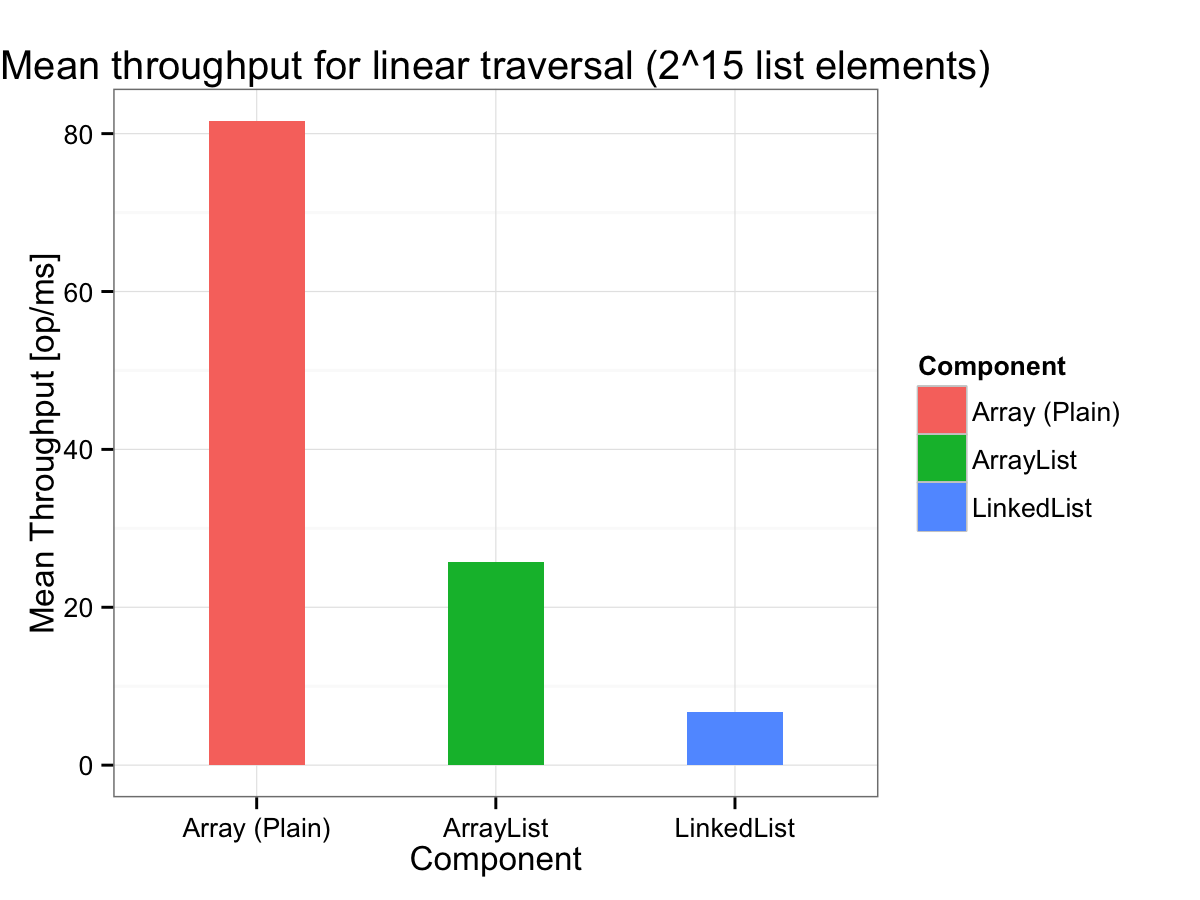
Why the difference?
Read CPU performance monitoring data with JMH's perf profiler
| Metric | int[] |
ArrayList |
LinkedList |
|---|---|---|---|
| L1-dcache-loads | 61 * 109 | 58 * 109 | 21 * 109 |
| L1-dcache-load-misses (relative to L1 cache hits) | 6 % | 10 % | 22 % |
Conclusion
Pointer indirection renders prefetching ineffective
Microbenchmark Limitations
Microbenchmarks are not the solution to every performance problem
- Don't generalize the results of a microbenchmark
Measure different workloads; Measure in an environment as close as possible to production - Don't optimize a component blindly based on a microbenchmark result
You might be looking in the wrong spot; use profilers to determine bottlenecks
Summary
- Microbenchmarks are hard
The JIT compiler, the OS and the CPU are trying to fool you - JMH helps a lot
JMH has the hard problems covered but you can still screw things up. Think whether the results are plausible. - Microbenchmarks have their limitations
Think in a broader context: Are the results applicable at all in your situation?
More Information
- JMH project page: http://openjdk.java.net/projects/code-tools/jmh
- Aleksey Shipilёv's Blog: http://shipilev.net
- My Blog: http://daniel.mitterdorfer.name
Slides
Image Credit
- Microscope Night by Machine Project (License: cc-by-nc-sa)
- Mazda 787B by YackNonch (License: by-nc-nd)
- Night mechanic by Ali Bindawood (License: by-nd)
- That is amazing
- Picture of Cliff Click
- Desperate Ladies, The Lighthouse, Glasgow by Gavin White (License: by-nc-nd)
- Tunnel by Julian Schüngel (License: by-nc-nd)