Latency Analysis of Elasticsearch
Written on
I currently work on the backend of Elastic Universal Profiling, which is a fleet-wide continuous profiler. In our benchmarks we have observed higher than desired latency in a query that retrieves data for flamegraphs. As this is a key aspect of our product we wanted to better understand the root cause.
CPU Profiling
We started to gather CPU profiles with async-profiler in Wall-clock profiling mode on the Elasticsearch cluster while it was processing a query:
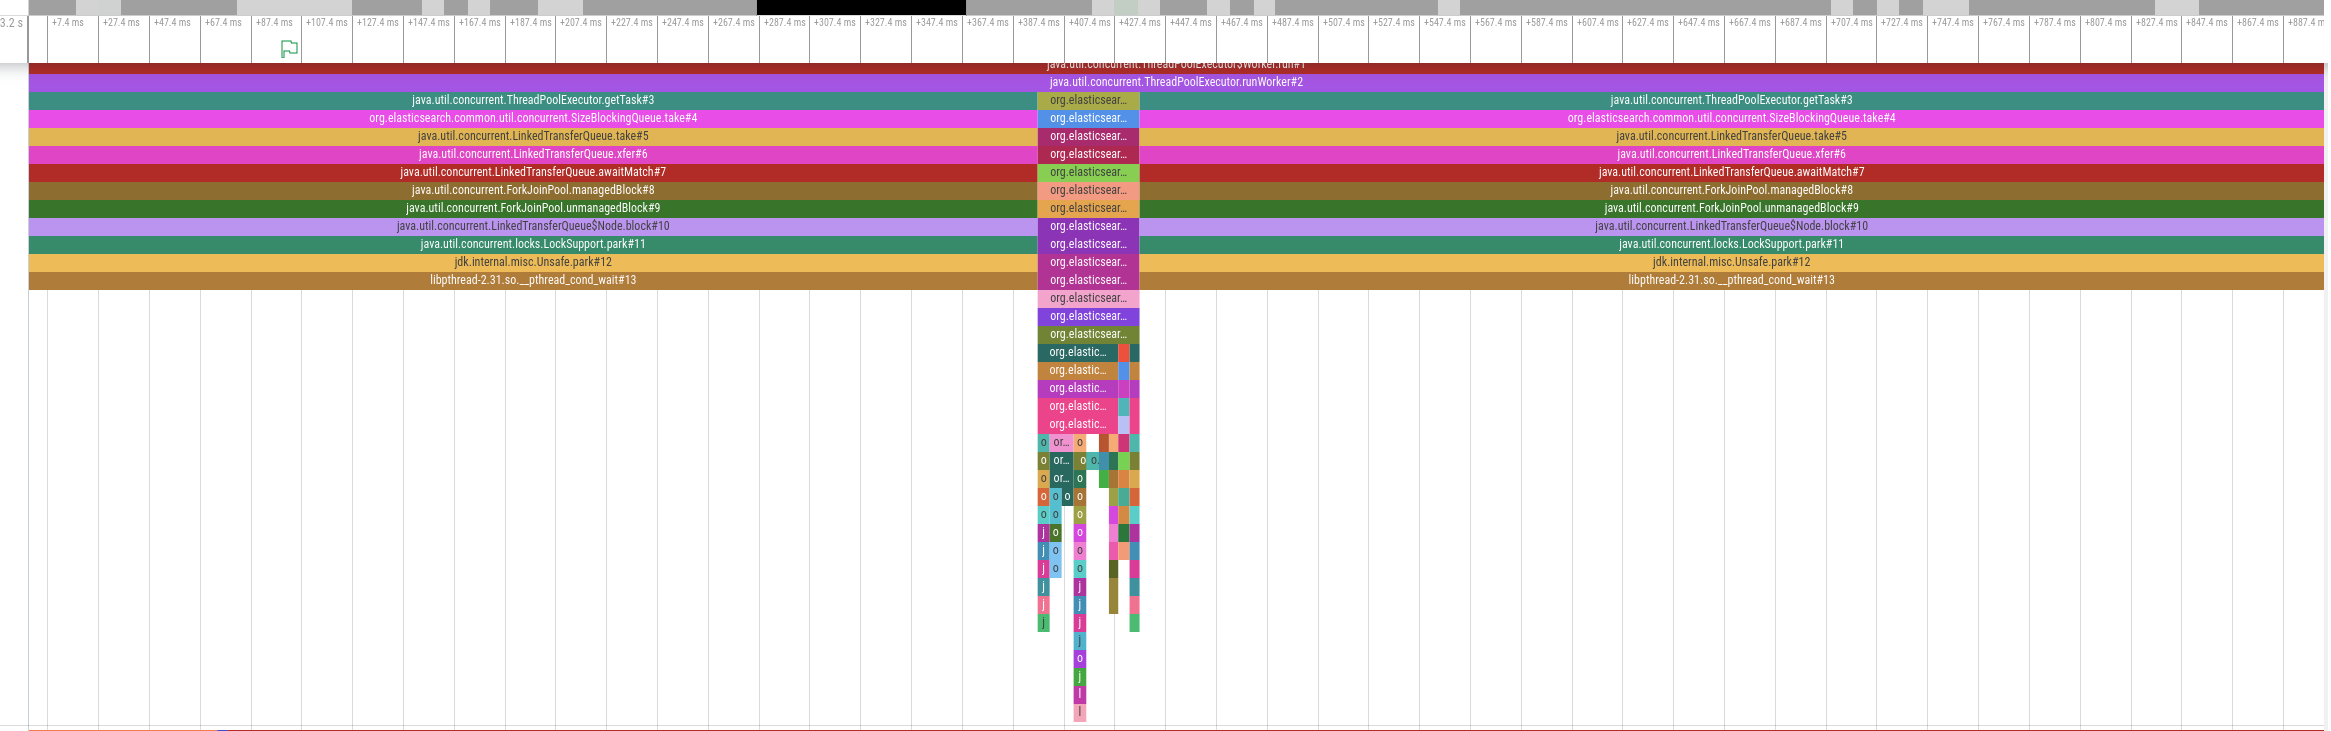
The diagram above shows an activity timeline for one of the threads involved in query processing.The thread is only active for a brief period of time around the middle of the timeline but is otherwise idle. Other involved threads show a similar pattern. In other words, this query is not CPU bound. We therefore analyzed disk utilization but also disk I/O was far below the supported IOPS. So if the problem is neither the time spent on CPU nor disk I/O, what should we do to get to the bottom of this mystery?
Off-CPU Analysis
Time for off-CPU analysis! Put bluntly, we want to see why the CPU is not doing anything. We will use perf sched record to do this. Around the time the query is executed, we’ll run the following command:
perf sched record -g -- sleep $PROFILING_DURATION
This traces CPU scheduler events and creates a perf.data file that we can analyze, e.g. using perf sched timehist -V. The data in this file tell us when, for how long and why a thread went off-CPU (slightly edited for brevity):
           time task name                       wait time  sch delay   run time
                [tid/pid]                          (msec)     (msec)     (msec)
--------------- ------------------------------  ---------  ---------  ---------
   15589.656599 elasticsearch[e[8937/8881]          0.000      0.000      0.020    [unknown] <- [unknown] <- [unknown] <- [...]
   15589.656601 Attach Listener[9157/8881]          0.162      0.000      0.053    [unknown] <- [unknown] <- [unknown] <- [...]
   15589.656601 <idle>                              0.023      0.000      0.231
   15589.656605 elasticsearch[e[8936/8881]          0.000      0.000      0.022    [unknown] <- [unknown] <- [unknown] <- [...]
   15589.656609 <idle>                              0.009      0.000      0.433
   15589.656616 elasticsearch[d[8953/8881]          0.000      0.000      0.014    [unknown] <- [unknown] <- [unknown] <- [...]
   15589.656623 elasticsearch[e[8956/8881]          0.000      0.000      0.014    [unknown] <- [unknown] <- [unknown] <- [...]
   15589.656753 <idle>                              0.053      0.000      0.152
   15589.656762 <idle>                              0.015      0.000      0.389
   15589.656765 <idle>                              0.015      0.000      0.173
That doesn’t look too useful because kernel symbols are missing. So make sure to install them first (check your distro’s docs how to do this). If kernel symbols are available, the output looks as follows (slightly edited for brevity):
         time task name                   wait time  sch delay   run time
              [tid/pid]                      (msec)     (msec)     (msec)
------------- --------------------------  ---------  ---------  ---------
 17452.955493 <idle>                          0.165      0.000      0.018
 17452.955494 elasticsearch[i[9782/8239]      0.000      0.000      0.044    futex_wait_queue_me <- futex_wait <- do_futex <- __x64_sys_futex
 17452.955507 elasticsearch[i[9388/8239]      0.000      0.000      0.036    futex_wait_queue_me <- futex_wait <- do_futex <- __x64_sys_futex
 17452.955509 <idle>                          0.041      0.000      0.464
 17452.955639 <idle>                          0.068      0.000      0.168
 17452.955682 <idle>                          0.027      0.000      0.208
 17452.955684 <idle>                          0.021      0.000      0.194
 17452.955687 <idle>                          0.024      0.000      0.170
 17452.955689 elasticsearch[i[5892/4393]      0.558      0.000      0.180    io_schedule <- __lock_page_killable <- filemap_fault <- __xfs_filemap_fault
That’s much better. Looking at the last line in the output, we can infer that an Elasticsearch thread was running for 180µs and was then blocked for 558µs because it caused a page fault. While this is useful, our ultimate goal is to analyze and eliminate major latency contributors. Just looking at this output does not help us understand what piece of code in the application has caused that page fault. Ideally we’d like to see the off-CPU profile integrated with the on-CPU profile. Then we’d be able to see what piece of code has caused the application to block and what it is blocked on (e.g. page fault handling, locking, blocking disk I/O).
Combining both Profiles
I wrote a program that parses the perf output file and injects the stacktraces into the on-CPU profile to provide a complete picture:
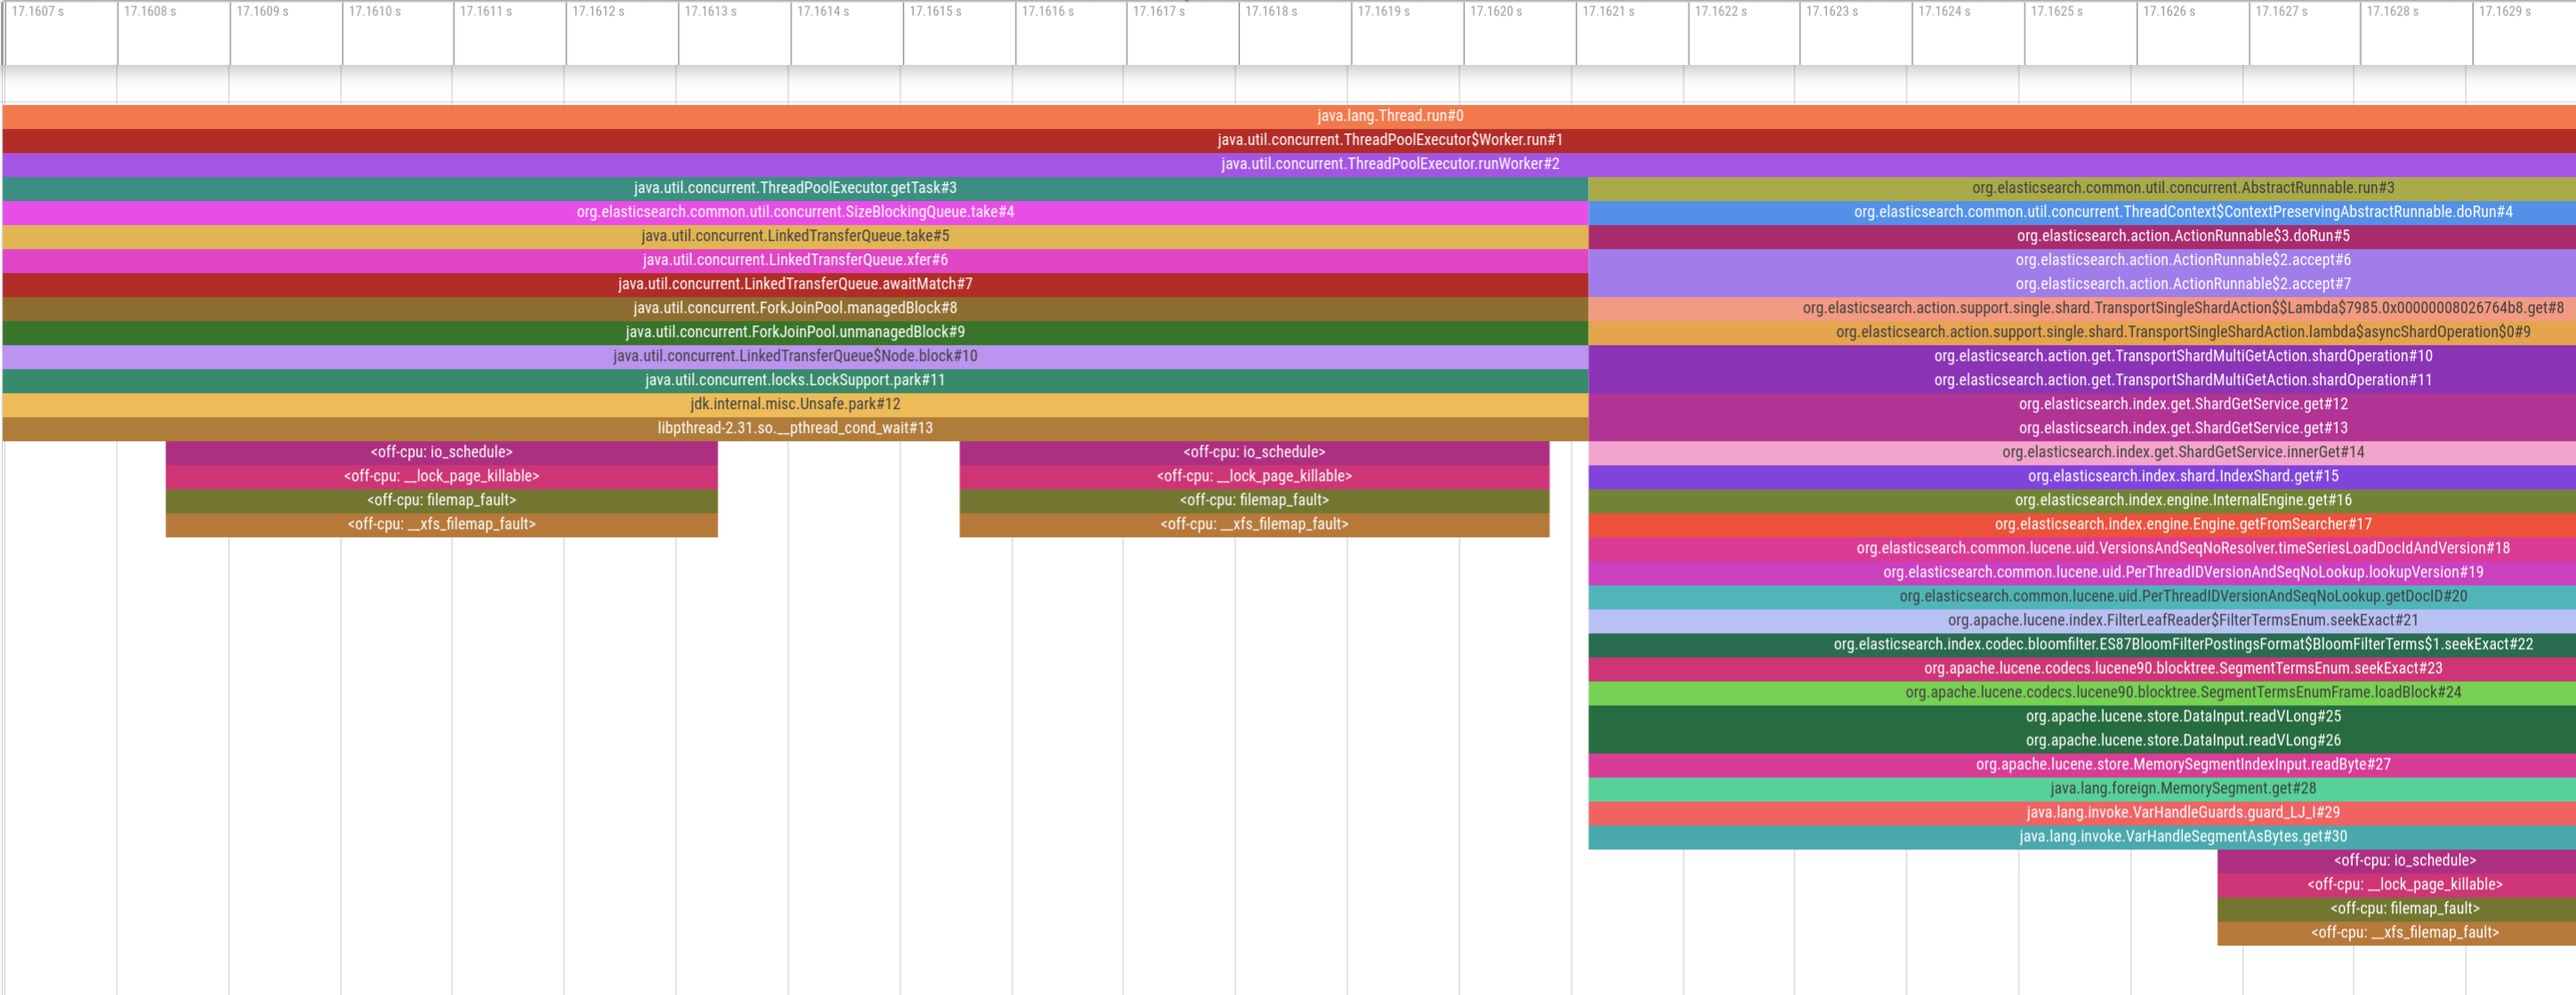
While this looks promising upon first glance, the two profiles are completely misaligned. The on-CPU profile at the beginning indicates that the thread pool is waiting for new tasks (i.e. it’s idle), yet we see several page faults occuring, which can’t be right. Therefore, the two profiles must be misaligned on the time axis. So, how exactly do both profilers get their timestamps?
perf record allows to control the clock with the –clock-id parameter. Several clocks are supported, among which we picked CLOCK_MONOTONIC. However, the clock in async profiler is based on the rdtsc instruction on Intel CPUs and non-configurable. rdtsc is basically a hardware counter on the CPU and an interesting topic on its own. For our purposes it’s sufficient to know that the two profilers use different clock sources. Therefore, I’ve raised an issue to add configurable clock sources to async-profiler which Andrei Pangin was kind enough to implement. With async-profiler 2.10 (not yet released as of October 2023) we can use --clock monotonic and force the same clock source in both profilers. This gives us aligned stack traces that combine both on-CPU and off-CPU states:
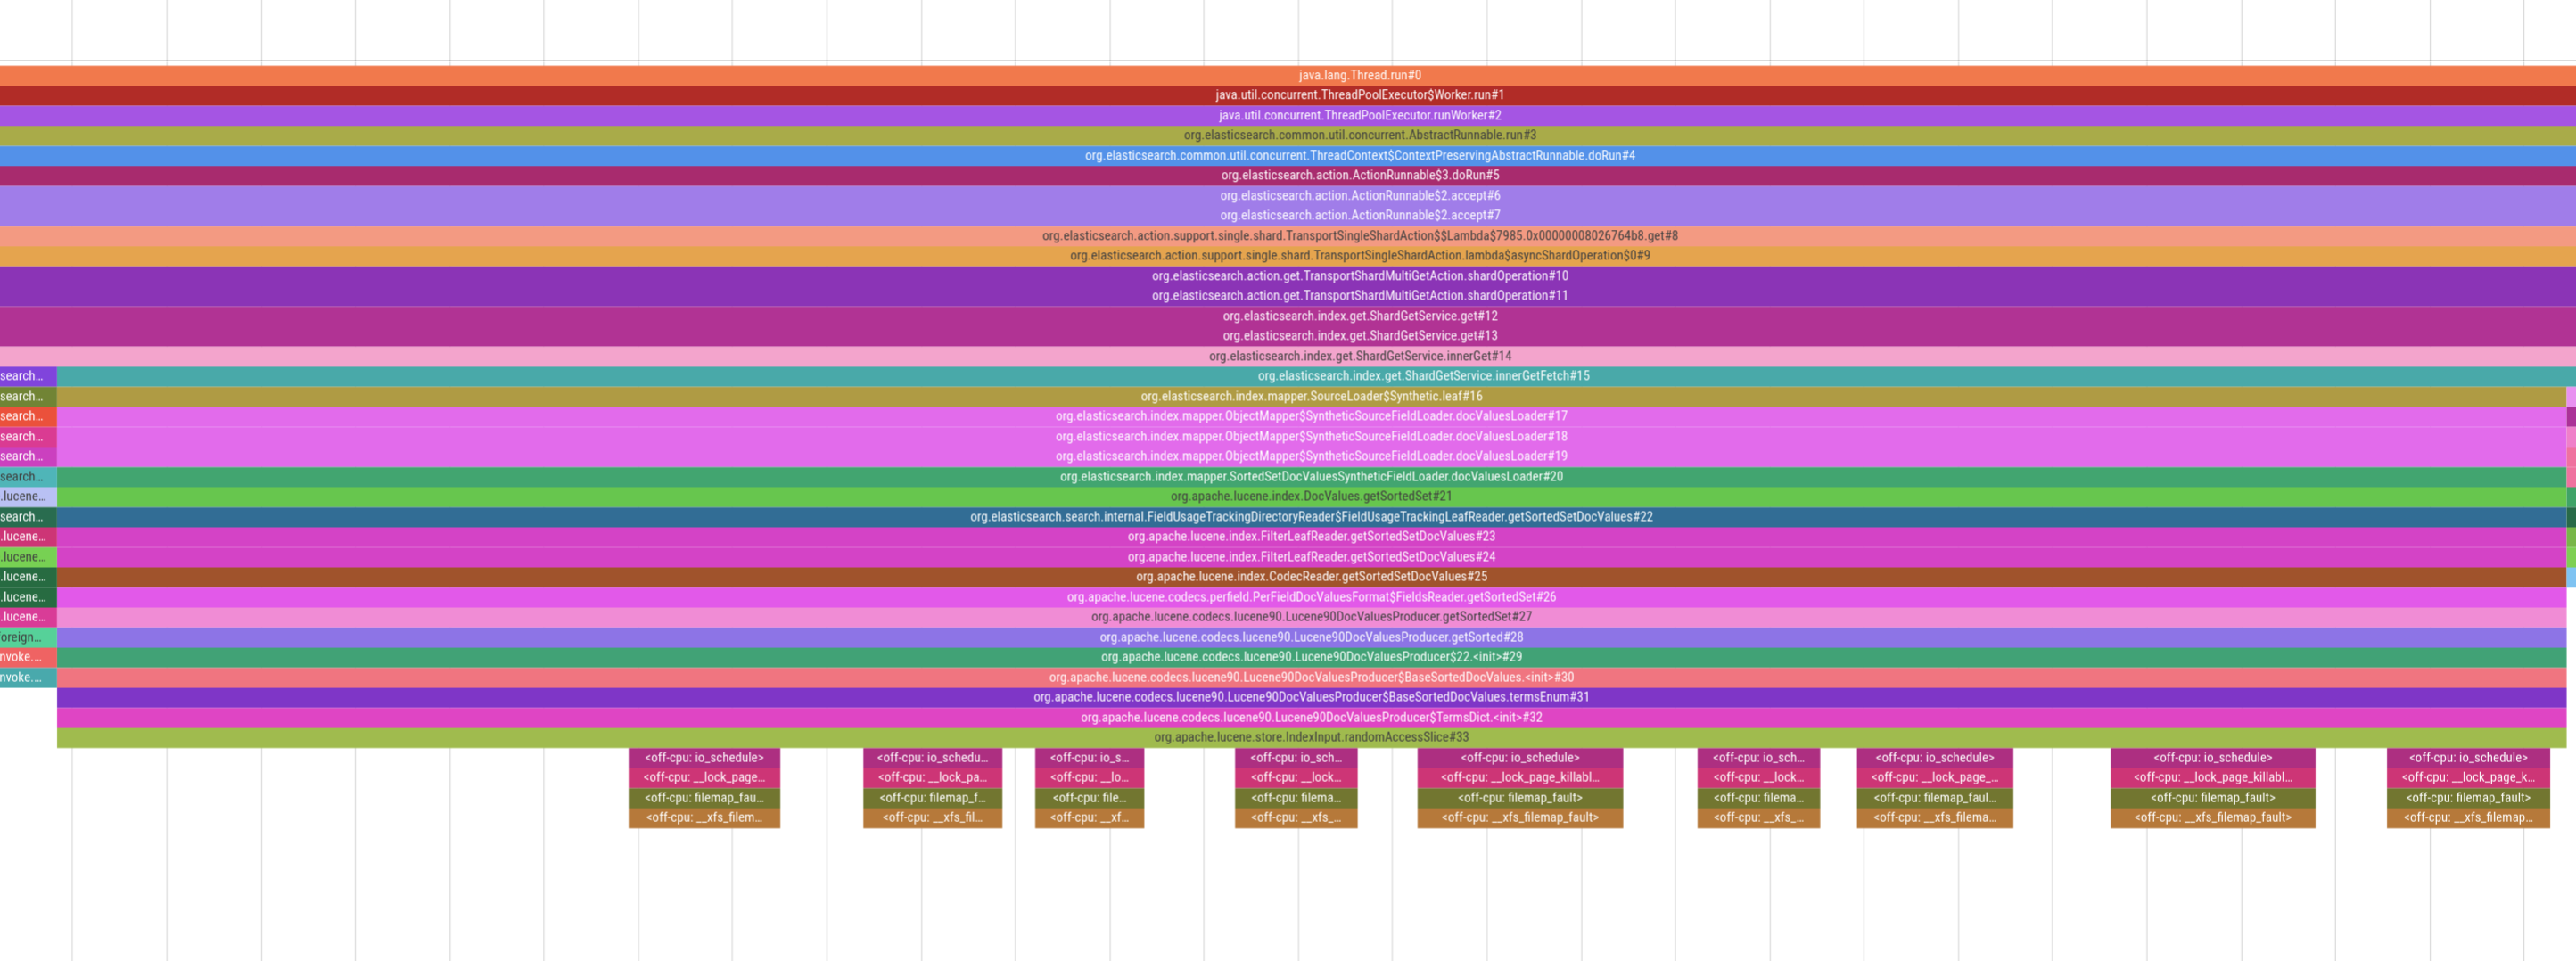
For example, in the picture above we see heavy page-faulting when accessing doc values in Lucene, which is the underlying search engine library that Elasticsearch uses. Being able to visualize this behavior allows us to provide an accurate diagnosis of the situation and then implement appropriate mitigations. Note that some stacktraces might still not be perfectly aligned because perf is tracing whereas async-profiler is sampling. But despite this caveat, seeing on-CPU and off-CPU behavior of an application has still proven extremely valuable when analyzing latency.